Trouble at the top
Inequality is back, and in a way few people anticipated before the financial markets meltdowns of 2007/8. Back then, to the extent that inequality was discussed (mostly on the left) it was in terms of the bottom of the income distribution. When people (not just on the left) talk about inequality today, they are much more likely to be talking about inequality at the top, indeed at the very top: not the top 20% or 10% but the top 1% or even 0.1%.
Does this focus on the top end indicate an ideological shift or is it a reaction to the (alleged) role of (some) high income groups in generating the crash? I suspect it's a bit of both- the crash and consequent fiscal problems serving to further undermine New Labour's 'vulgar Rawlsian' prioritisation of inequality at the bottom through redistribution,which was widely seen on the left as a second-best strategy http://lartsocial.org/nothingless. But new research results would make inequality at the top an issue even without these factors. Long-run data in this area is a relatively new phenomenon and is threatening to upset the already shaky foundations of our understanding of capitalism and inequality.
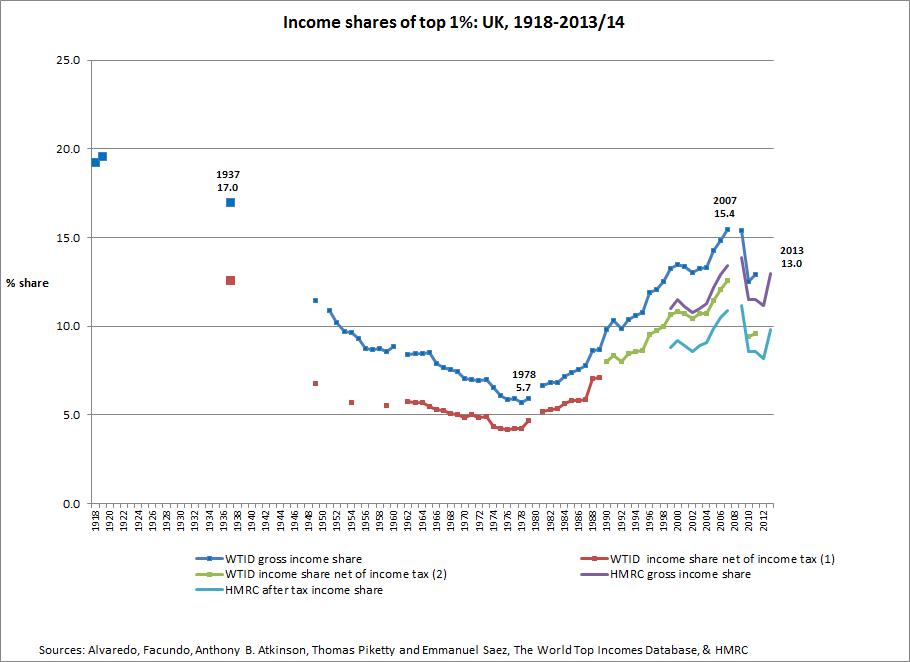
By way of example, the chart at the top of this article presents an underappreciated fact thrown up by Tony Atkinson's long-run time series for the income share of the UK top 1% for the World Top Income Database (hereafter, and in the chart, WTID) http://topincomes.g-mond.parisschoolofeconomics.eu/. Inequality at the top in the UK is back to levels we haven't seen since the Second World War and the foundation of the modern welfare state.
The dark blue curve and points show how the share of gross income of the top 1% (before tax but including social security benefits) evolved from the first world war to 2011. There are only three years of data prior to 1949, but that's enough to reveal the historical pattern. In 1918 and 1919, the top 1% accounted for nearly a fifth of all gross income. By 1937, that share had fallen only to 17%. As we all know, inequality on a range of measures fell in the postwar period and rose in the 1980s and early 1990s, stabilising or falling modestly under New Labour. The 1%'s income share fell to 11.5% in 1949 and reached its lowest point in 1978 at 5.3% before starting to rise. But unlike many other inequality measures, the top income share continued to grow in an almost linear fashion from 1981 to 2007, with only a couple of inflections along the way. By 2007, the top 1% commanded 15.4%, very close to their share in 1937, and they also held exactly the same share of income net of income tax as in 1937. (Of course the rich should one hopes have been paying more in other taxes in 2007, like everybody else.)
It's true that the 2008 crash temporarily wiped out a substantial chunk of the top income share, although the retiming of income flows to minimise the impact of the 50% top marginal rate is also playing a role here. In any case, more recent data from HMRC, using a different income concept, shows that the share is well on its way back to 2007 levels (13% compared to 13.4%)- the purple curve on the chart. As the HMRC series and the WTID series have tracked each other closely in the past (correlation coefficient = .93) we can be fairly confident that the crash was only a temporary setback for the 1%.
The UK has not (yet) turned back the course of history as much as the United States, where the top income share is back to its 1919 level. Nonetheless there is something profoundly unsettling about inequality at the top reverting to levels last seen in the days of the Cliveden Set and 'The Road to Wigan Pier'. As the WTID data shows, this is not a generalised phenomenon.The only other country I can find in the WTID which has reverted to pre-welfare state levels is Australia which also, not coincidentally, registered a particularly low top income share in the 1920s and 1930s. We tend to think of rising inequality as an endemic feature of contemporary economies: not only is this not universally the case, but even where inequality has risen, scale matters. The UK and the United States really are exceptional.
So concern about inequality at the top is hardly misplaced. Something very odd has been going on for a long time. Obviously the 1% income share raises questions about the distribution of tax liabilities. But redistribution is a poor framework for thinking about inequality at the top. The real concern is about power, not incomes, and that concern is both retrospective (where did these incomes come from?) and prospective: modern democracies have not had to deal with these concentrations of resources since their infancy.
Where does inequality at the bottom feature in this post-Rawlsian world? The victims of excessive top-end inequality, we are constantly told, are not the poor but the long-suffering middle classes. And as they seem to be just as inclined to blame those at the bottom of the income distribution for their problems as those at the top, a view which the rich have been diligent in encouraging, we have a discourse of inequality which is often evasive about poverty and dismissive of redistribution. A reminder, if one were needed, that 'equality' as a political slogan can mean very different things depending on the context and who is using it.