We should expect something better than 'not quite false' from the Treasury
The chart/table are based on those provided by the Treasury and reported in yesterday's Telegraph http://www.telegraph.co.uk/finance/personalfinance/consumertips/tax/1074... As far as I am aware I've used the same source material. The main difference is that the Treasury chart includes social services spending under 'welfare', something taxpayers receiving the government's new 'tax statements' later this year are unlikely to be aware of....
The government wants to send personalised 'tax statements' to everyone paying income tax and National Insurance Contributions showing how 'their' tax contributions are spent. Mock-ups produced by the Treasury were reported on in yesterday's Telegraph http://www.telegraph.co.uk/finance/personalfinance/consumertips/tax/1074... . These showed that 'welfare', not including 'state pensions', was the largest single expenditure category, accounting for some £1,024 of the taxes paid by someone with an income tax and NICs liability of £4,542. Health, the next largest category, accounted by contrast for only £842.
This is obviously intended to send a clear message to taxpayers. However, the message, if not quite false, is far from being true.
The reason government is able to send misleading not-quite-false messages about 'welfare' spending is that 'welfare' is not a category in any of the existing systems for reporting public expenditure: not in the Treasury's own budgeting framework, not in the Public Expenditure Statistical Analyses, not in the UK (or any other country's) system of National Accounts, not in Eurostat's European System of Integrated Social Protection Statistics and not in the international Classification of the Functions of Government (COFOG). The introduction of a 'welfare cap' in the 2014 budget is an ad hoc change which doesn't alter the essential arbitrariness of the 'welfare' label- as witnessed by the fact that the 'welfare' line in the Treasury's mocked-up 'tax statements' includes expenditure which lies outwith the cap (on unemployment benefits and some housing benefit).
In order to get at its 'tax statement' figures, what the Treasury seems to have done is to take data on expenditure by COFOG category for 2012/13 from the annual Public Expenditure Statistical Analyses publication for 2013, tweaked some of the categories and done a lot of relabelling.
Now COFOG categories are far from transparent even to regular users of public finance data, and in some cases can be positively misleading for those unfamiliar with the underlying conventions. Perhaps the most risky of all the categories is 'social protection', the one the Treasury used to get at its 'welfare' category. Although this is sometimes erroneously used as if synonymous with social security, it also includes personal social services and public sector pensions.
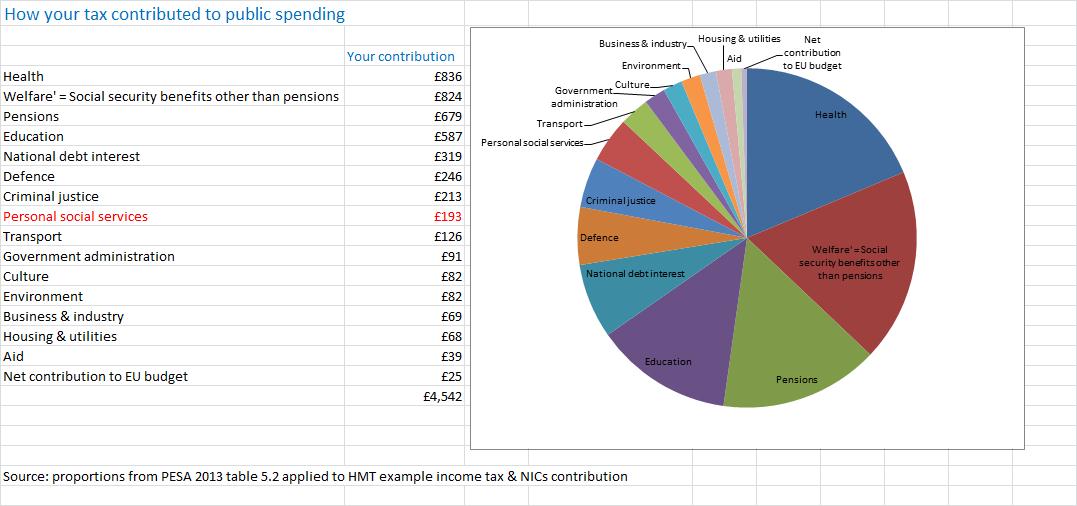
The figures used by the Treasury for 'welfare' are rather clearly those for the broad COFOG 'social protection' category, but with one of the sub-categories, 'pensions', taken out and presented separately (and somewhat misleadingly) as 'state pensions'. The remainder, which includes some £29bn of personal social services spending (for 2012/13) is then presented as 'welfare'. (See the image at the top of this article, which is based on the chart/table in the Telegraph story but with social services presented separately.)
Will income taxpayers realise this when they receive their statement from the government next autumn? Of course not. They will assume that transfer payments to people of working age are by far the biggest element in public expenditure. And this is not the case: removing social services spending brings the figure for 'welfare' down to slightly below the level of healthcare expenditure. Or, to use the Treasury's preferred strategy of expressing spending in terms of personal tax contributions, it reduces 'your' contribution to 'welfare' spending from £1,024 to £824.
A further problem with the Treasury's presentation concerns the UK contribution to the EU budget. The figures presented seem to be based on the UK's gross contribution, taking no account of flows of funding in the opposite direction, thus nearly doubling the cost to UK taxpayers. It looks very much as if the Treasury has been seeking to exaggerate spending on politically salient and unpopular functions (or perhaps there was a typo?).
The presentation of the public finances requires an accounting framework. COFOG, for all its imperfections, offers such a framework. But when the categories have been amateurishly relabelled and fudged, with categories of different levels being mixed up and gross figures being substituted for net, the result is meaningless as data. The cynical response is to say 'That's politics'. But one of the purposes of accounting systems is to limit the ability of politicians to misinform the public about the public finances. We are entitled to expect public servants to adhere to the standards set by these systems, not to hunt out ways of exploiting their complexities to blow smoke in the public's face. 'Not quite false' is not good enough.