Household worklessness at small area level
A quick table based on Census 2011 data showing household level worklessness at the fine-grained geography of lower layer super output areas (LLSOAs) - average population 1,600 and average number of households 672, so these are very small areas indeed. There are nearly 35,000 LLSOAs in England and Wales.
The unit is Household Reference Persons (HRPs), which have replaced the antiquated and gender discriminatory 'head of household' for the purposes of summarising household variables. Because of the way the HRP is defined, if the HRP is out of work, all other adults in the household will be out of work as well.
I put this table together for other reasons, but I decided to put it out today when I saw this sentence in an article on youth unemployment in the Guardian: 'In some parts of the country, more than 50% of the population is on out-of-work benefits.' http://www.theguardian.com/commentisfree/2014/jan/03/right-left-failing-... Of course this statement is true almost by definition, as 'some parts of the country' could refer to any geographical level down to a one-room flat. Thus the statement conveys no information whatsoever.
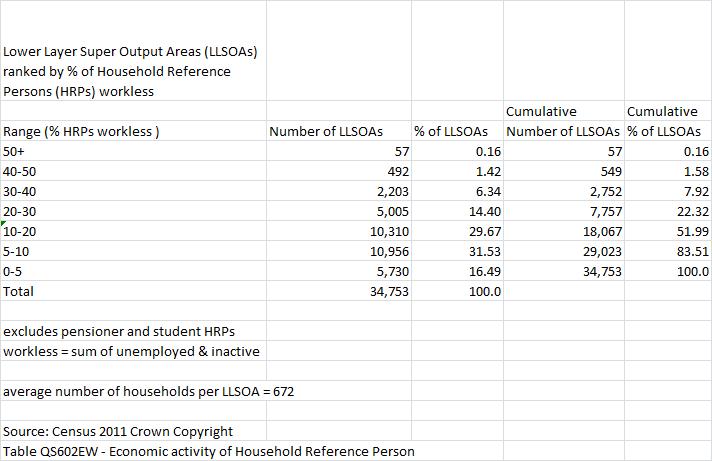
ONS doesn't publish rates of benefit receipt at this geographical level any more, and I've used household worklessness, defined as the sum of unemployment and economic inactivity for non-retired and non-student HRPs. (Back when ONS did publish these rates, the results were very similar.) As the table shows, the number and percentage of areas where 50% or more of households are workless are tiny- 57, or 0.16 % of LLSOAs. Moreover in only 1.6% of areas are less than 60% of HRPs (excluding pensioners and students) in work, and in only 8% less than 70%. The great majority of people who are out of work live in areas where the great majority of people are in work.
So a more accurate and informative version of the statement in the Guardian would be 'In virtually no part of England and Wales are more than 50% of the population reliant on out of work benefits.'