Economic activity, hours worked and diminished expectations
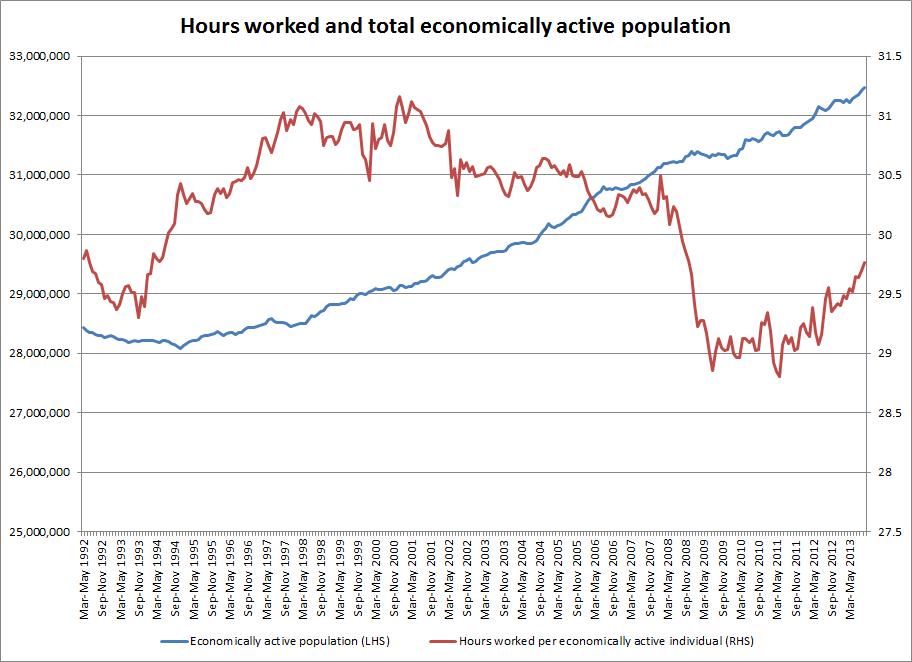
This chart brings together data on two important aspects of the current employment situation in the UK - the total number of people in the labour market (economic activity) and hours worked.
The economically active population of the UK has been growing almost continuously since the late 1990s. As of August-October 2013, the total number of people (aged 16+) either in employment or looking for work was 1.25 million higher than at the onset of recession in the corresponding quarter of 2008 (the blue curve on the chart). The trend is mainly driven by demographic changes, in terms of both the total population and the age composition of the population, and by increased economic activity among the over-50s, partly reversing the sharp decline in activity for older men which kicked in in the 1980s.
As is widely recognised, the long employment downturn we have been experiencing was marked by a lower unemployment rate than might have been expected given the scale of the output shock. One of the reasons unemployment didn't rise as much as had been feared was that firms and workers reduced the number of hours worked. While this cushioned the impact of recession, it meant that the unemployment rate probably wasn't telling us as much about the gap between labour supply and demand as in previous downturns.
Another way of looking at the trend is to look at the average hours worked per economically active individual, which is what the red curve in the chart shows. (Note that the scale starts at 27.5, so the fall in hours worked with the onset of recession looks rather dramatic.) The average over the entire period covered is 30.1 hours per week. From January-March 2008 to June-August 2009, average hours worked per economically active individual fell from 30.4 to 28.8. That may not sound like much, but multiplied by 31 million it adds up to a lot of hours lost. And of course, this is not just a matter of everyone dropping an hour and half from their working week- the fall is composed of people losing work altogether, people seeing their hours cut by half and so on.
We can also see that average hours were lower in this downturn than in the last major recession. There's a caveat on that point though, because there may have been shifts in the average number of hours people wanted to work over the period, for example if there was growth in the number of people who wanted to work part-time, which was an implicit aim of some government policies under Labour. (So it's not strictly accurate to take growth in the number of economically active people as a measure of labour supply growth.) A better measure for longer term comparison would be the underemployment index developed by Bell and Blanchflower http://niesr.ac.uk/press/underemployment-uk-11285#.UrGMusVipI0 which takes account of the numbers working more or fewer hours than they would have liked (I'm not sure that the data exists to take that measure back to the early 90s though). Changes in preferences over hours worked are less likely to be an issue when we're looking at the period from 2008, but they can't be ruled out- for example, there has been continuing growth in lone parent employment and activity which would suggest more people looking for part-time work.
Finally, what does this tell us about the current situation, as shown in today's monthly labour market statistics release? After a long period of oscillation, a positive trend in hours worked begins towards the end of 2012 and continues up to August-October of this year. Today's statistics are good news in terms of closing the gap between supply and demand, albeit jobs quality, employment conditions and earnings remain concerns. Hours worked seem at last to have started to keep pace with growth in the labour force. But compared to the last recession the recovery in hours looks sluggish and there is still a substantial shortfall compared to the pre-recession period and the long-term average- in other words, underemployment is still a major issue. The news is good, but we shouldn't let diminished expectations exaggerate how good it is.
Data is here http://www.ons.gov.uk/ons/publications/re-reference-tables.html?newquery... Tables A05 (economically active age 16+) and HOUR01 (total weekly hours- millions).