Big words,thin ice. IDS on worklessness and social housing.
In the spirit of scrupulous fairness I've looked at two possible data sources- see the update to the article for the second. On balance I now think Mr Duncan Smith is probably guilty of confirmation bias rather than of deliberately selecting the stats to make his case, so please read the update as well as the article.
Here we go again. From today's Express:
‘In an exclusive interview ahead of the annual Tory conference starting on Sunday, the Work and Pensions Secretary revealed that cuts to jobless hand-outs had reduced the number of workless households in council homes to the lowest level since records began.’
This looks like a big claim. Low employment in the social rented sector has been a serious policy headache for a very long time. Iain Duncan Smith seems to be claiming to have made major changes where previous governments have failed.
Note however that Mr Duncan Smith’s claim is very specific: it refers to council housing, not to social rented housing, 55% of which is accounted for by housing associations. This is odd, because none of the policy changes that the coalition has made in social security specifically target local authority tenants as opposed to housing association tenants.
But is the claim true? In a very narrow sense, yes: the key phrase is ‘since records began’. In fact, consistent data on household employment for council (as opposed to social) tenures only begins in 2008/9. Data for households renting from councils prior to that date, from the old Survey of English Housing, is unreliable because many housing association tenants reported (in good faith) that they were council tenants- a consequence of council housing stock transfers to housing associations, which tenants did not necessarily recognise as a change of landlord. The old survey tables therefore carried a big health warning on breakdowns between council and housing association tenures. The new tables from 2008/9 from the successor survey, the English Housing Survey (EHS), make a correction for misreporting of tenure type, so the figures for households renting from councils can be regarded as reliable. Obviously the phrase ‘since records began’ does imply a rather larger historical sweep than this data provides.
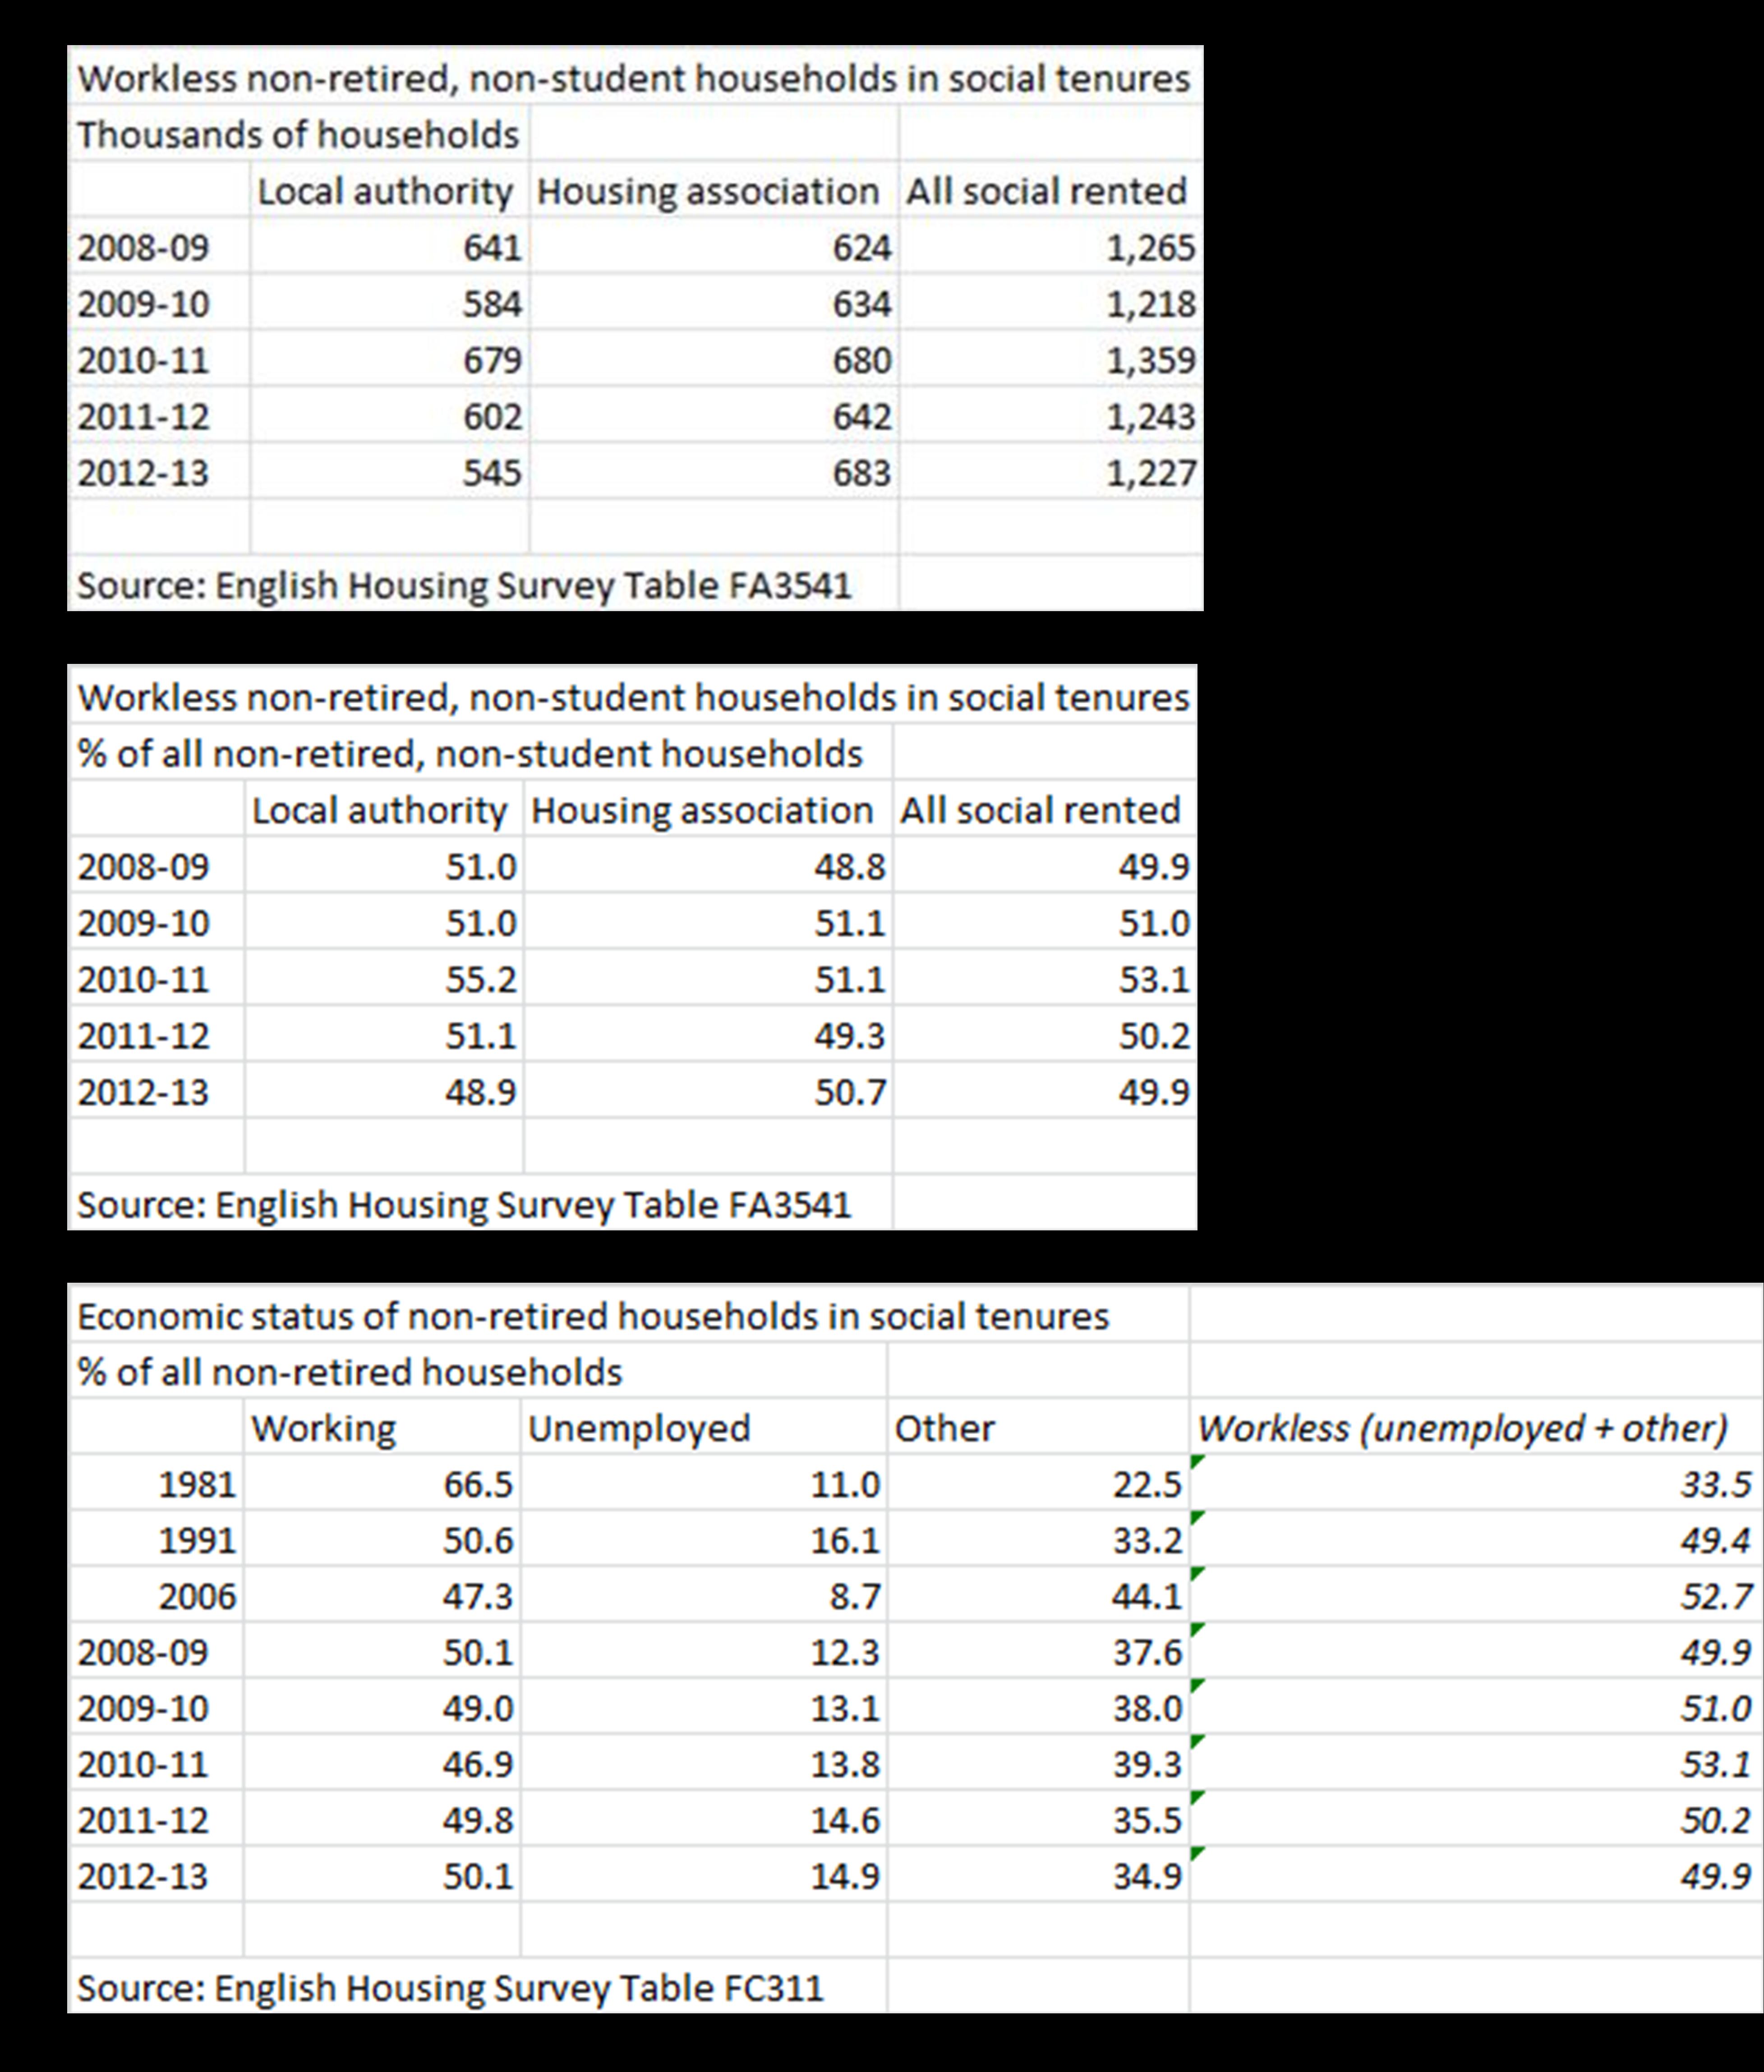
I’ve tabulated the relevant data from the English Housing Survey at the top of this article. The first table shows the numbers of households in which the household reference person (roughly, the oldest economically active member of the household) was neither working, retired nor a full-time student. If the HRP is not working, this means that no adult in the household is working, so these figures show the number of workless non-retired, non-student households. The number of workless households (in this sense) renting from the local authority is indeed the lowest since records began all those years ago in 2008/9, 545,000 compared to 641,000 in 2008/9, a fall of about 15%. But the number of households in council housing is also smaller, by about 11%. Meanwhile the number of workless households in housing association tenures is higher. If we look at all working age households in social housing, the number of workless households is 1,227,000, slightly lower than in 2008/9 but slightly higher than in 2009/10. So Mr Duncan Smith’s claim only stands up for households in council accommodation, not for households in the social rented sector as a whole.
Obviously the number of workless households in council accommodation is not a useful indicator of anything given that the number of households is falling overall. The second table converts the figures in the first table into percentages of non-retired, non-student households. The percentage of workless households in council housing is the lowest since 2008/9, 49% compared to 51%. But the percentage is up on 2008/9 for housing association households and there is no change at all from 2008/9 for the social rented sector as a whole.
But what about the longer term? Is it true that the numbers of workless (non-retired, non-student) households in council housing is at an historical low? Quite possibly, because the number of local authority dwellings is at an historical low – just over 2 million compared to 6.6 million in 1981. Again numbers are of no relevance here given the decline in the council housing stock: we need to look at percentages.
Over the longer term, as we have seen, this is only possible for the social housing sector as a whole, but all is not lost. In 1981, the earliest year for which data is published, housing associations accounted for less than 7% of social housing, so it’s not illegitimate to compare the workless percentage for the council-dominated social sector in 1981 with the percentage for the local authority sector in 2012-13. These figures are shown in the third table. In 1981, just over a third of non-retired households in the social sector were workless, compared with 49% in council housing in 2012/13 (and 50% in the social sector as a whole). That (combined with the very low share of housing association properties in 1981) makes it arithmetically impossible that the rate of household worklessness in council housing is lower now than in 1981.
Over the longer term then Mr Duncan Smith’s claim stands up only because it is couched in terms of numbers (in a declining local authority sector) rather than rates. The percentage of workless households in council housing rose dramatically in the 1980s and has changed very little since then, moving between about 49% and about 53%. For the social sector as a whole, worklessness under the coalition has returned to the rate registered in 2008/9.
Now there are other data sources for household employment in the social sector, and I don’t know which one Iain Duncan Smith is using to back up his claims. It could be that his choice of data for council housing, to the exclusion of the rest of the social sector, has nothing to do with the fact that the claim he makes in the interview is only, just about, true for council housing on the EHS data and clearly untrue for social housing as a whole. But he seems to want to use this claim to underpin some strong messages about the coalition’s record on welfare reform:
‘Mr Duncan Smith made clear that the role the welfare crackdown has played in boosting economic recovery will be a key theme of the conference. And he highlighted falling levels of claims on housing estates previously in the grip of welfare dependency, the kind of communities depicted in TV shows like Shameless and Benefits Street.’
Given these hubristic assertions, it’s worth being clear about what the EHS data shows. It shows that there has been no substantial change in worklessness in the social housing sector under the coalition, apart from a sharp increase in 2010/11 which has since been reversed. Mr Duncan Smith is fantasising again.
Update
Or is he? It’s occurred to me that another possible data source for Mr Duncan Smith’s claims is the ONS series ‘Working and workless households’. http://www.ons.gov.uk/ons/publications/re-reference-tables.html?edition=... This includes a tenure breakdown, although it only distinguishes between social and private renting, not between council and housing association tenures. If we assume that what the Express reported as ‘council housing’ was in fact social housing- i.e. that the Express misquoted the Secretary of State- this source would bear out Duncan Smith’s claims with regard to the prevalence of household worklessness. As of April-June 2013, the household worklessness rate was 42.8% in social housing compared to 46.1% in the same quarter in 2008. The series runs from 1996 and the 2013 rate is indeed the lowest on record.
Why do these figures differ from those from the English Housing Survey? I don’t know for sure but there are two obvious suspects. The ONS series covers the UK while EHS covers, obviously, England. More importantly, the ONS series covers households which include an adult aged 16-64, while I’ve used figures for non-retired households- that is, households where the household representative is not retired. The ONS definition of a workless household is ‘a household that includes at least one person aged 16 to 64 where no-one aged 16 or over is in employment.’ This definition will include some households that would be classed as ‘retired’ in the EHS data. For example, a couple where one partner is retired and one is neither retired nor working, as long as one of the partners was under 64, would be counted as a workless household in the ONS series but is more likely to be counted as a retired household in the EHS data*.
I suspect that shifts in retirement patterns are playing the main role in reducing household worklessness rates in the ONS series over the last three years, and probably in explaining the apparent divergence between the ONS series and EHS with regard to social housing. Certainly the only age band where the chances (for individuals) of being in a workless household are the 'lowest on record' on the ONS series is the 50-64 group. For other age bands, rates are around where they were prior to the recession, apart from 16-24 year olds where the chances are a bit higher. If later retirement is the driver, that would explain an interesting feature of the ONS data: rates of worklessness are at their lowest on record for all tenure types - social rented, private rented, buying with a mortgage and owned outright. There's nothing obviously distinctive about the social sector with regard to the trend. (The levels of worklessness are of course a different matter.)
In any case, I feel I should withdraw the accusation of fantasising, at least as regards the data. Mr Duncan Smith may well have used the ONS series and been misquoted by the Express as to exactly what sort of housing tenure he was talking about. Of course, I still think he’s fantasising about the reasons for the fall in worklessness. Employment rates for the over 50s have been rising since well before he took up his current position. The fantasy is in attributing these changes to his own actions. It's still big words and thin ice.