Housing crisis? What housing crisis?
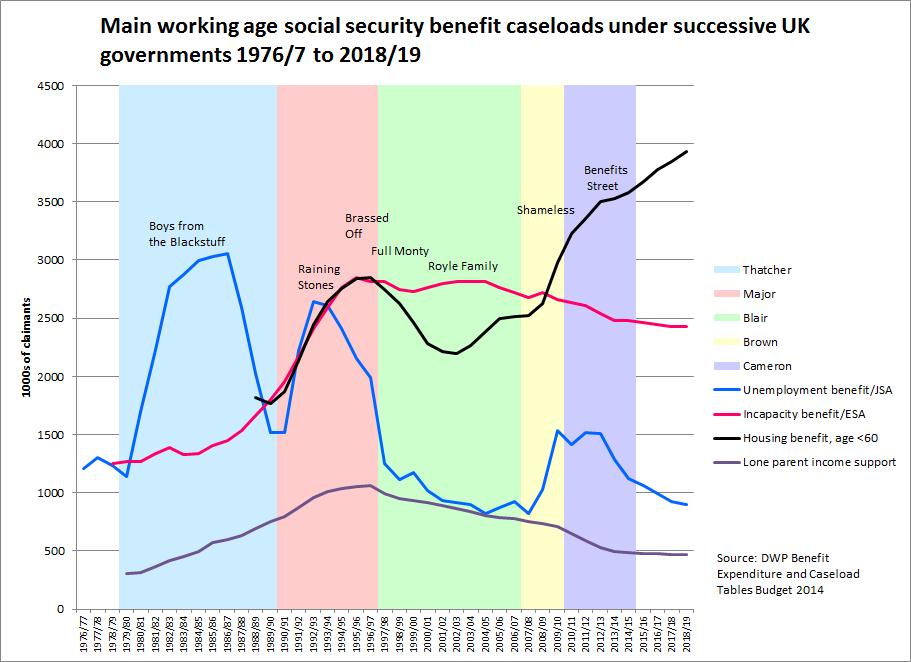
Here's a chart showing British working age social security benefit caseloads over time, matched up with the administrations of different prime ministers and what seemed to me to be some of the relevant cultural highlights of the time.
Among the things that strike me is how trends for different benefits dominate particular administrations: unemployment benefit, obviously, under Margaret Thatcher, 'inactive' benefits (incapacity benefits and income support for single parents) under John Major, rapidly falling caseloads under Tony Blair except for incapacity benefit, the return of unemployment under Gordon Brown at much lower levels than in previous recessions. And the coalition? For all the rhetoric, mostly the experience has been one of continuity with trends under Labour, with single parents' employment continuing to rise, only modest falls in incapacity benefit/ESA (despite aggressive reassessment of existing claims) coupled with stagnation in unemployment until last year.
But there is one trend which looks set to become as emblematic of this government's record on social security as the exploding incapacity benefit caseload was of John Major's. Working age housing benefit receipt in 2013/14 was higher- much higher- than it had ever been. Compared with the previous, mid-1990s peak there were about 700,000 more claimants, and more than a million more than on the eve of recession in 2007/8. This is a big change in the landscape of British social security. (If it has failed to attract comment, that may be because the growth in the working age caseload has been masked by a long-term decline in housing benefit receipt among pensioners.)
Another point revealed by the chart is that even if specific benefits dominate the agenda for individual governments, trends rarely begin with changes in administration. The late 1970s were already seen as a period of high unemployment well before the crisis of the early 80s; upward trends in inactive benefits began under Margaret Thatcher, not John Major, and the downward trend in single parents' benefit receipt began under Major, not Blair. In retrospect, we can now see that the recent rise in the housing benefit caseload was at least foreshadowed under Labour, with the caseload rising by about 300,000 between 2002/3 and 2005/6.
At the time of this year's budget, DWP was forecasting a continuing rise up to 2018/19, which would take the working age caseload to just shy of four million, an additional 400,000 claims. Now, the department’s forecasts have proved inaccurate before (in 2010, they predicted working age claims would fall every year of this parliament) and the most recent figures from DWP’s Stat X-plore database of housing benefit data show modest but accelerating reductions in caseload from September 2013. On the other hand, I doubt DWP have just pulled their forecast figures out of the air: it would be useful to know what factors (employment, demographics, tenure, rents etc.) are driving them. It is possible that we have already passed the peak in working age housing benefit. It's also possible that we ain't seen nothing yet. But what we've seen so far is of a scale we haven't experienced before, and whoever forms the next government is going to inherit most of it.
What's going on? It is easy to show that most of the rise (whether since 2008 or since 2010) is accounted for by working families, that about half is in the private rented sector and that families with children dominate. These comparisons of caseloads at points in time don't really capture all the dynamics though. For example, the increase in working households on housing benefit is not just a matter of falls in earnings or rises in rents drawing more families into benefit receipt. Some of it is due to families, especially single parent families, moving from out of work benefits into work that doesn't pay enough to lift them out of benefit receipt. Behind the net growth in benefit receipt lie intertwined shifts in tenure, employment status, earnings, rents and savings and possibly in household structure, not all of which can be teased out using available evidence. Nonetheless, data from the English Housing Survey indicates higher probabilities of claiming since 2008/9 in all tenures, for working and out of work families, and for all household types except pensioners and couples without children (See especially tables FA3242 and FA3244 here https://www.gov.uk/government/statistical-data-sets/social-and-private-r...). It also indicates (although this is more tentative, based on comparing caseload composition rather than rates) that the probability of claiming increased for households with both full-time and part-time workers. (This data only runs up to 2011-12.)
What we can say is that there are a lot more people (a million or so) who can't meet housing costs without help than there were before the recession. One of the consequences is that a lot more families face high marginal deduction rates on their earned income, as housing benefit is withdrawn at 65p in the pound (compared to 41p for tax credits). Add in council tax benefit withdrawal and this can rise to 85p or higher*. Contrary to popular belief (and ministerial rhetoric) this does not mean that people are better off on out of work benefits, but it does mean that increasing earnings - for example, through a second partner in a low-paid household taking up work- can have little impact on household income. The coalition didn't invent the in-work poverty trap, but it has presided over a considerable widening of its reach.
The big question is how far the caseload increase to date represents a structural change in reliance on benefits for working families or an effect of the prolonged economic downturn. I don't think anyone really knows the answer to that question. But what has happened so far, let alone what DWP is predicting will happen, looks like a case where a much-abused term can for once be used without exaggeration. It looks unsustainable.