Myths and counter-myths
I'm not sure where this chart https://twitter.com/GavinEdwards77/status/329203347208949760/photo/1 which has been doing the rounds on twitter originates from, but it seems to have quickly acquired mythological status. It appears to show the number of times the word(s) 'scrounger(s)' appeared in the UK press from 1994 to the present, with a huge unprecedented rise coinciding with the arrival of the coalition in power. I can see why people have seized on it, given the sustained campaign against benefit claimants in parts of the print media and the government's willingness to stoke the flames by selective, and in some cases deceptive http://www.guardian.co.uk/commentisfree/2013/apr/15/conservative-claims-... use of official data. But the picture it gives of trends over time is almost certainly exaggerated.
The underlying data in the chart comes from a database called LexisNexis. This is an indispensable resource for looking at media coverage over extended periods, but as any researcher who has worked with it will tell you, it needs to be treated with caution, and especially when trying to construct a time series. The main reason is that titles appear in the database at different times: if you're looking at the mid-1990's, the only titles included are the Mirror, Mail, Times, Guardian and Independent. If you're looking at 2013, the Sun and Express are included, as well as the Telegraph. That is hardly a minor difference when you're doing searches on words like 'scrounger(s)'.
There are other problems to do with duplicate articles, inconsistent inclusion of regional, Scottish and Irish editions and coding errors, all of which have to be dealt with to get to anything like a consistent series. When Kate Bell, Ben Baumberg, Dan Sage and I looked at media coverage last year for this report http://www.turn2us.org.uk/PDF/Benefits%20Stigma%20in%20Britain.pdf we commissioned a purpose-built database from website designer Clancy Hood to iron out these problems, as well as manually cleaning the articles we'd sourced from LexisNexis to remove irrelevant material. Analysis of media coverage over time is a demanding task. Even with a customised database, producing and coding a series from 1995 to 2011 represented several weeks work.
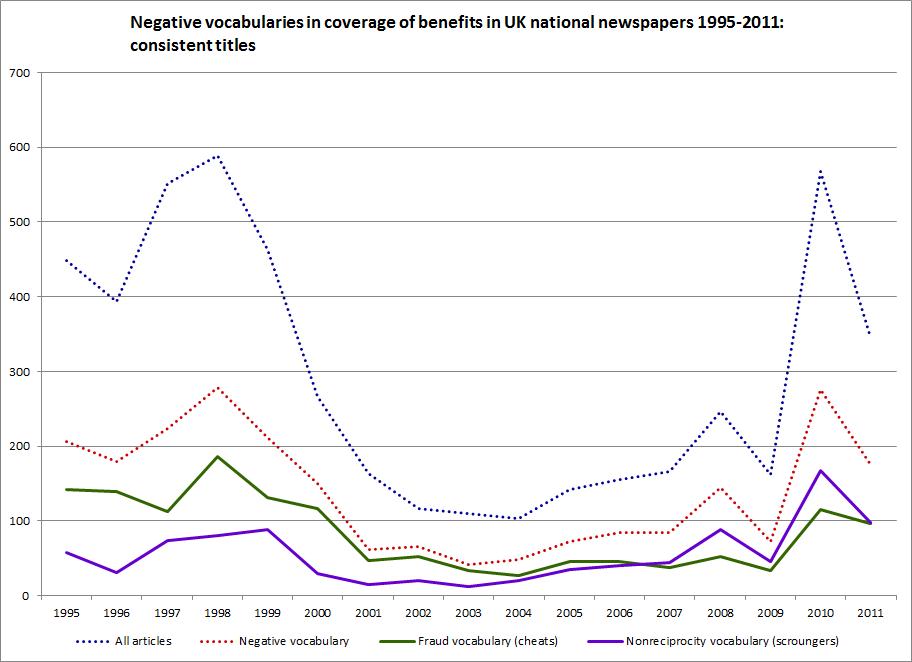
We didn't just look for the word(s) 'scrounger(s)' , we constructed a set of word-lists intended to capture broad categories of negative vocabulary such as fraud and dependency. 'Scounger(s)' was included in a word-list we called 'non-reciprocity', along with terms like 'handout(s)', 'shirker(s)' and 'something for nothing'. The chart shows some of the results for a consistent set of titles from 1995 to 2011.Note that we are counting /articles/ in which one or more terms from the word-lists are used, not /occurrences/ of terms from the word-lists (which would give much bigger numbers). And our dataset is confined to articles which are about benefits (identified through manual checking). The titles are the Mail, Mirror, Guardian, Times and Independent. This means the data has two types of bias: political (only one title consistently supported the Conservative party over the period) and market (only one red-top tabloid). But the biases are consistent over the period, which makes comparisons over time feasible.
So has there been an unprecedented rise in the use of 'scrounger' and related terms? Yes - see the purple curve on the chart- but it's on quite a different scale to that shown in the other chart. The difference is, I presume, mainly to do with our use of a consistent set of titles. We just don't have data for the Sun and Express for the 1990's, and these are by far the most virulent titles when it comes to coverage of benefits.
What is perhaps of more interest is that overall use of negative vocabularies is very similar in 2010-11 and 1998-9 (the dotted red curve). But there has been a pronounced shift in the language used to convey negative messages away from fraud (although this remains very important) and towards non-reciprocity: from 'cheats' to 'scroungers'.
Using consistent data which has been checked and cleaned makes for a less striking chart, but it allows us to put recent coverage into a longer-term context. On this evidence, negativity in press coverage of benefits has not been at unprecedented levels: the first years of New Labour's period in office were very similar to the coalition's first years in this respect. The reason is that media coverage is strongly skewed towards negativity in all periods and in both these periods there was a lot of coverage. But since 2008, negativity has increasingly taken the form of accusations of 'scrounging', while in New Labour's first years in office the focus was on fraud, largely because this was a theme the government chose to highlight.
It's widely argued that there has been a shift in public attitudes towards benefit claimants over recent decades, with no signs of an increase in sympathy when unemployment rose in 2008/9, in contrast to earlier periods http://www.bsa-29.natcen.ac.uk/read-the-report/welfare/introduction.aspx. And it's tempting to see negative media coverage as the culprit here. Our report did find evidence that attitudes are influenced by which newspaper people read, but when it comes to explaining shifts in attitudes over the longer term, increased negativity in the press seems an unlikely candidate, just because UK media coverage of benefits has been strongly negative for as far back as we can go using this data.
It may be that the press and the political right have become more efficient in tapping into public anxieties and grievances- maybe 'scroungers' is a stronger framing than 'cheats'. It may be that New Labour's borrowing of political vocabulary from the right ('something for nothing', 'dependency culture') recast the terms of debate, so that negative attitudes which were always to some extent in play were legitimised and made respectable. But a simple story of media manipulation, evidenced by counting occurrences of negative language, seems to be ruled out. That doesn't mean there is no manipulation of course. There is a lot, and most of it is clearly politically inspired. But this is only part of a larger story. Those worried about public attitudes to benefits and claimants need to ask why negative coverage finds such a ready audience.