Living standards in the European club of rich nations
There’s a lot of interest at the moment in how living standards have changed over time, especially in the UK and the US. But how do living standards compare across countries at a single point in time? By any measure, the UK is one of the wealthiest countries in the world, belonging to a select club of nations in which living standards are very high by global standards. But how does it compare to the other members of the club? How do the living standards of people at different points in the UK income distribution compare with those of people at similar points in the distribution in other rich countries? Are the UK's better-off as well-off as those in comparable countries? What about the worst-off and those in the middle? Data from Eurostat allows us to answer these questions, at least as regards the European members of the rich nation club.
There are many ways in which we could attempt to measure living standards. One of the most common is to use net income (after direct taxes and benefits) adjusted for household size and composition (a process known as ‘equivalisation’). This isn’t perfect: it doesn’t include for example the value of goods and services funded through taxation, such as education and healthcare, and it misses many of the things which are most important to quality of life – public goods and bads such as climate, cultural heritage, pollution and congestion and so on. Nonetheless this measure is vastly superior to, for example, GDP per capita or individual income, which tell us nothing about how incomes relate to living arrangements.
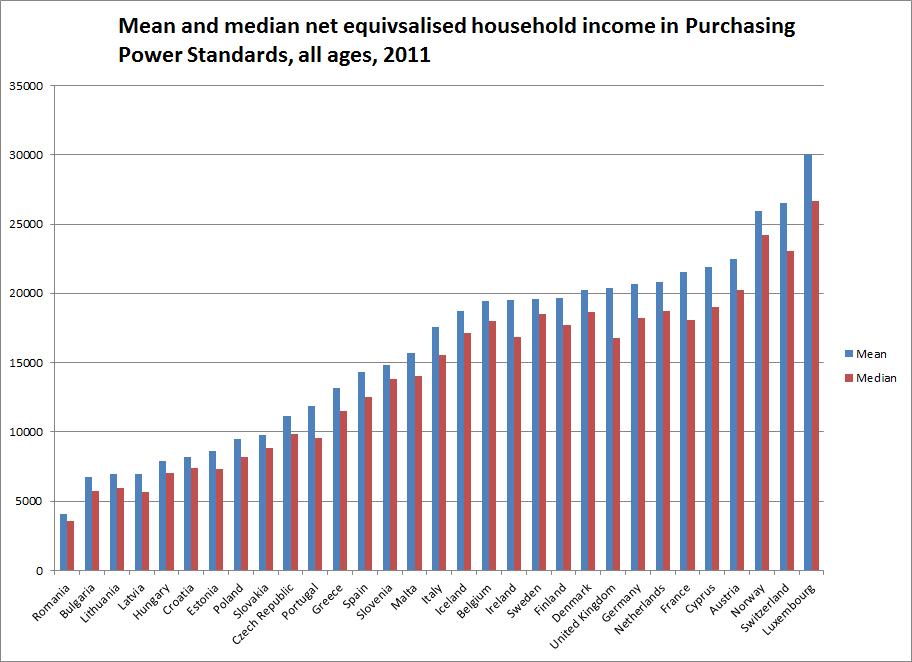
Eurostat provides data on the income distribution for most EU, European Economic Area and EU candidate countries. In order to control for differences in price level between countries- which are substantial even within the Eurozone- incomes are converted into an artificial currency, Purchasing Power Standards, intended to represent equal purchasing power across countries. The chart shows how countries compared in 2011, the last year for which data for the UK is available, ranked by mean household income. In what follows, I want to focus in particular on the top 14 countries, the club of very wealthy European nations which have GDP per capita above the EU 28 average, running from super-rich Luxembourg and Norway to Iceland.
Looking at mean household income, the UK is ranked 9th from the top, very close to Germany and Denmark. But when we look at median income – the mid-point of the distribution- this is considerably lower in the UK than in Germany or Denmark. In fact, on median income the UK is ranked 14th out of 14 in the rich nation club. This immediately suggests that income inequality needs to be taken into account if we want a fair comparison: higher incomes at the top of the distribution push up the mean but not the median.
Taking account of this inequality requires us to look across the income distribution. That’s what this table http://lartsocial.org/PPSdeciles does: it looks at how household incomes compare when we divide the population into ten equal sized groups, called deciles, ranked by their income. The measure is the break point between deciles- for example, the first decile break point is the income threshold above which 90% of the population stand. (Thus there are nine breakpoints for the ten deciles.)
The table shows two things: the ranking within the rich nation club and the percentage difference in income compared to the UK (the ratio to the UK, minus one. I’ve multiplied this measure by 100 to convert to percentages.) In terms of rankings, the UK is 14th out of 14 across the first five deciles. It begins to move up the ranking at the sixth decile break point, to twelfth, then ninth and then to sixth at the top decile break points. So the impact of inequality on the comparison isn’t confined to the top or bottom of the distribution. People in the UK have the lowest living standards in the rich nation club until we reach the top half of the distribution.
The differences with Ireland, the next in the ranking, are negligible except at the very bottom of the distribution. But comparing to Germany and Denmark, which as we’ve seen have almost identical mean household incomes, the bottom decile is 8% better off in Germany and 21% better off in Denmark. At the fifth decile break point, Germans are nine per cent better off and Danes 11%. The difference with other nations, apart from Ireland, are substantial at most points in the lower half of the distribution.
But by the time we get to the top of the distribution, incomes in the UK are some 8% higher than in Denmark, although only slightly higher than in Germany. Apart from the super-rich group of Luxembourg, Norway and Switzerland, it is only in France and Austria that those at the top of the distribution are doing better than in the UK. Meanwhile, incomes at the top are a lot lower than in the UK in Belgium, Finland, Sweden and Iceland.
So when we compare the UK with its fellow rich European nations, those in the bottom half of the income distribution have the lowest living standards, although the UK and Ireland are very similar. In the European club of rich nations, low and middle income UK and Ireland residents are the least rich. It is only for the upper part of the income distribution that living standards in the UK are higher than in other countries. The better-off in the UK are about as well off as the better-off in Germany and France. But both the worst-off and the middle income groups in Germany and France are substantially better off than in the UK (and Ireland), as is the case for most of the other countries in the club. The UK is a member of the rich nations club, but that doesn't mean that the majority of people in the UK have living standards as high as most people in the other countries in the club.
Although they do of course have higher living standards than the great majority of the world's population.