Did claims for DLA increase in the run-up to PIP?
In an article in yesterday's Evening Standard Iain Duncan Smith is quoted as saying that there has been an increase in DLA claims because people were trying to qualify for the benefit before its replacement by the new Personal Independence Payment introduced this week. "We've seen a rise in the run-up to PIP. And you know why? They know PIP has a health check. They want to get in early, get ahead of it. It's a case of 'get your claim in early'.'' http://www.standard.co.uk/news/politics/disabled-reforms-are-common-sens...
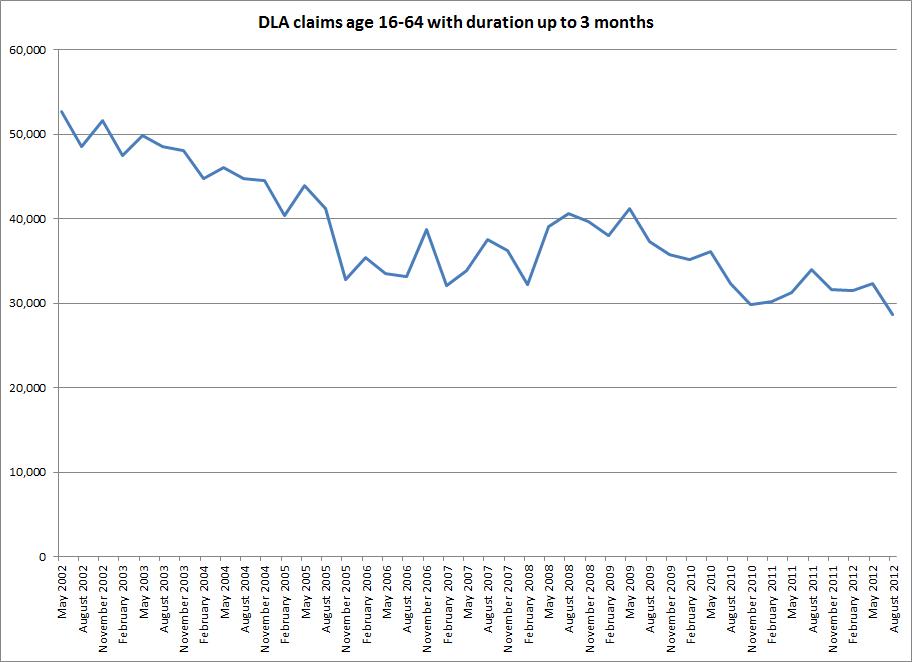
I presume Mr Duncan Smith has some basis for this claim, but it's not supported by the published data on DLA. The changes only affect people of working age, so I've charted the number of claims by people age 16-64 with a duration of three months or less, using the data available on Nomis. A sudden increase in people claiming should show up in these figures: I don't see it. On the contrary, the latest figures are the lowest on record. Note that these figures are for new claims, not for the total caseload.
In another article http://www.telegraph.co.uk/news/uknews/immigration/9978231/Disabled-bene... it is claimed that there has been a rise in claims in the North East and North West. On the same basis as the national data in the chart I still don't see it. You can get the data here https://www.nomisweb.co.uk/ [Update: it's now in the attached workbook]
The data only runs up to August 2012. Maybe there's been some change since then? But ministers are bound by National Statistics rules on the use of official statistics prior to publication, so if there's any new data it should be publicly available.
See also
http://www.disabilinet.com/profiles/blogs/latest-disabilinet-news-govern...
Update 15:20
It gets worse. Let me explain.
Say you suspected people who would be affected by the change to PIP were rushing to get new DLA claims in: how would you go about checking this? It's obvious: you would look at new claims for the benefit from people in the relevant age groups (16-64) and compare them with earlier periods. That's what I've done here.
You would not look at changes in the caseload, because that wouldn't tell you anything about whether new claims had increased (change in the caseload will reflect both on- and off-flows). You especially wouldn't look at changes to the overall caseload for all ages, because only people of working age are due to be affected by the changes.
In the Telegraph story cited above, there are some very specific figures: claims for DLA are said to have increased by 2,600 in the North East and 4,100 in the North West. It took me a while to locate the source for these figures because it never occurred to me that anyone could be so amateurish as to use caseload change to back up an assertion about new claims. That is precisely what has happened here. I downloaded the total caseload time series from DWP's tabulation tool and looked at the years to August 2011 and 2012 for both regions. The fit is exact, as you can see from the sheet labelled 'DWPtabtooldata' in the attached workbook.
Caseload change can not support the assertions made by Mr Duncan Smith. But the data does show something else. When we look at those affected by the replacement of DLA with PIP - claimants aged 16 to 64 - the numbers in both the North East and North West are /down/ over the same period. The figures are not only irrelevant to the claims made by Mr Duncan Smith, they show the opposite of what he says. (The data here is from Nomis, sheet labelled 'Nomis total' in the workbook. It's slightly different to the DWP tabtool data because it covers all entitled cases, not just all cases in payment. Nothing funny going on here - like most people, I just prefer using Nomis to DWP's wretched interface.)
I can only conclude that whoever put these figures together either didn't know what they were doing or, worse, new exactly what they were doing and was out to deceive.
I find it hard to believe that ordinary DWP civil servants could possibly have been party to such amateurish and misleading distortion of what are, after all, National Statistics. It is possible the briefing was pulled together by someone with a political role, either within the Department or at Conservative Central Office. Whatever the case, this raises serious issues about the use of official statistics in briefing by or on behalf of ministers.