More people in work than ever before? More people.
DWP press office put out this tweet in response to yesterday's monthly labour market statistics from ONS:
'Esther McVey: Employment up 1m since 2010 & more in work than ever before = positive sign of growth in economy & credit to British business.'
It's hard to imagine a statement better designed to get the heads of labour market analysts hitting desks. David Blanchflower, who knows a few things about the UK labour market http://www.dartmouth.edu/~blnchflr/papers/bell&blanchflower2013.pdf , responded angrily: 'why dont you go the whole hog and claim unempt rate is 2% wage growth is 7% per annum and empt is rising 1 million a week?'
In fact statements from ministers about the UK having the highest levels of employment on record have been a regular occurrence for quite a while. To be fair, Gordon Brown used to use almost the same soundbite. Nonetheless there is something distasteful about a department with the formidable analytic capacity of the DWP disseminating this sort of confusion.
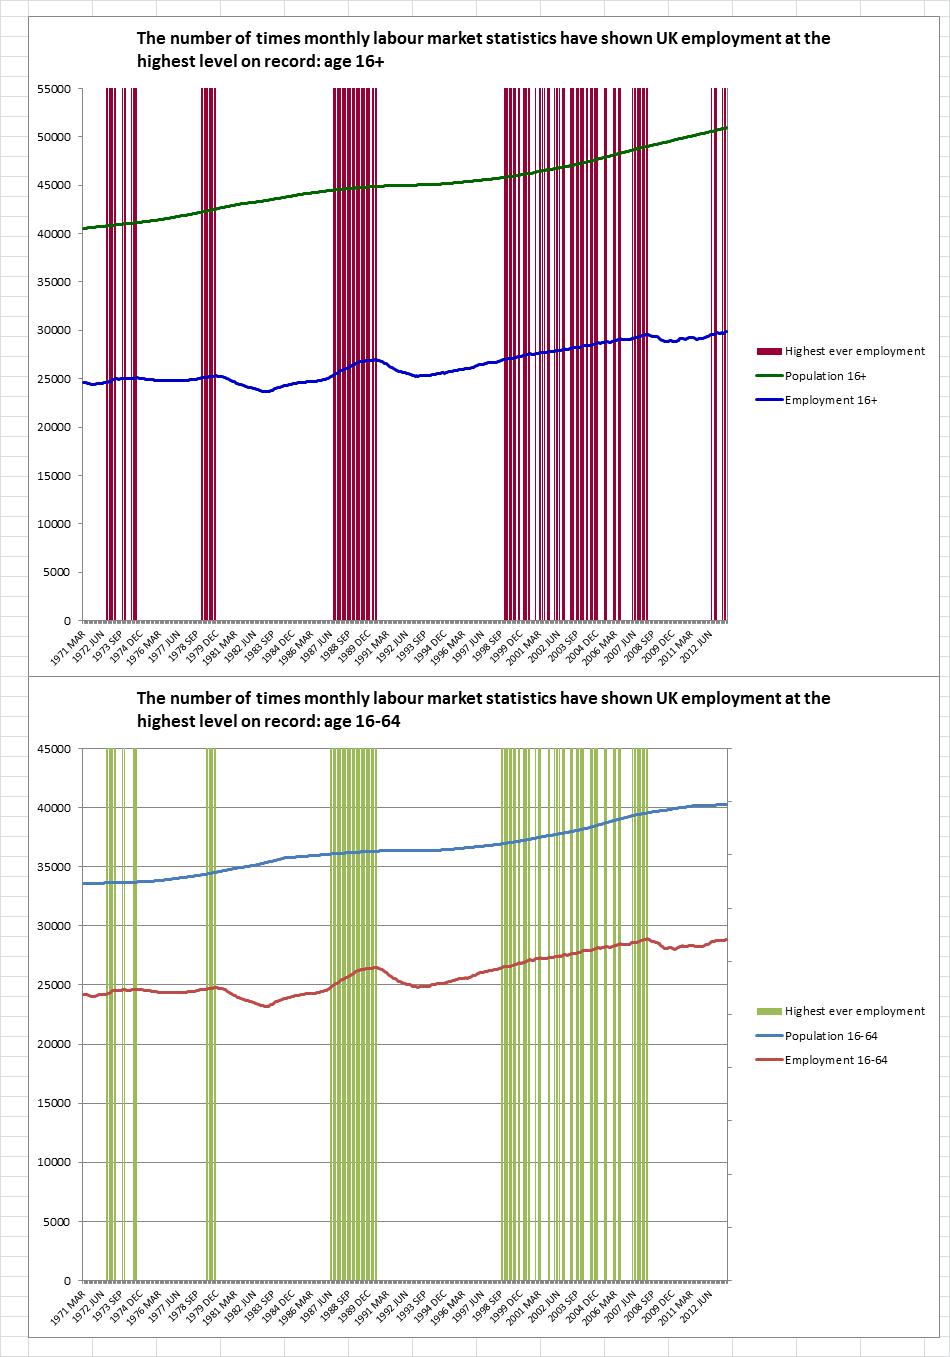
I've updated a chart I did last year to show just how common it is for the UK to break employment records. Since monthly figures began in March 1971,this has happened 144 times, marked by the vertical red lines on the chart. The population figures (green curve) show what lies behind these record-breaking occasions. At the moment, labour demand is weak, but not weak enough to consistently offset the effect of demographic change: thus the figures from time to time show 'more people in work than ever before'. Nonetheless, despite near-linear population growth, this has happened in only 8 of the 38 months of coalition government (up to July 2013).
It's also worth noting that for people of what we used to think of as 'working age' (age 16-64), as opposed to the entire adult population, the record hasn't been broken at all under the coalition, despite continuing demographic growth. A lot of the employment growth is among people over retirement age. Working age employment has improved but remains well below its pre-recession level.
So when Esther McVey boasts about more people being in work than ever before, she is really asking us to congratulate the government (and British business!) for population growth. Not for the first time http://www.newstatesman.com/blogs/economics/2012/07/telegraph-and-mail-s... , I find myself wondering what is more worrying about DWP ministers' innumerate statements - the thought that they are being disingenuous, or the thought that they might actually believe this stuff.
(By the way, I don't intend to update these charts again, but they're easy to reproduce. Put ONS's monthly employment series from 1971 (for working age or 16+) into a column. If the first cell is say B3, enter into cell C4 the formula IF(B4>MAX(B$3:B3),1,0). Copy down: the 1s show when employment is at its highest level on record. Summing the column gives the number of times this has happened. When charting put the second column data onto a secondary vertical axis, set the scale maximum for the secondary axis to 1 and get rid of the axis labels.No doubt others will have more elegant ways of doing all this.)